5.0 on Google
    Google Partner
    Official WhatConverts Partner
    BBB Accredited
    $20M+ in client revenue tracked
    Real Results

    Tracked Revenue From Contractor Markets We Rank

    Every dollar below is tied to a tracked lead and pulled straight from the client's own CRM export. Nothing is guessed at, and nothing is rounded up. Every number can be traced back to the source report.

    Closed Revenue, Straight From the CRM
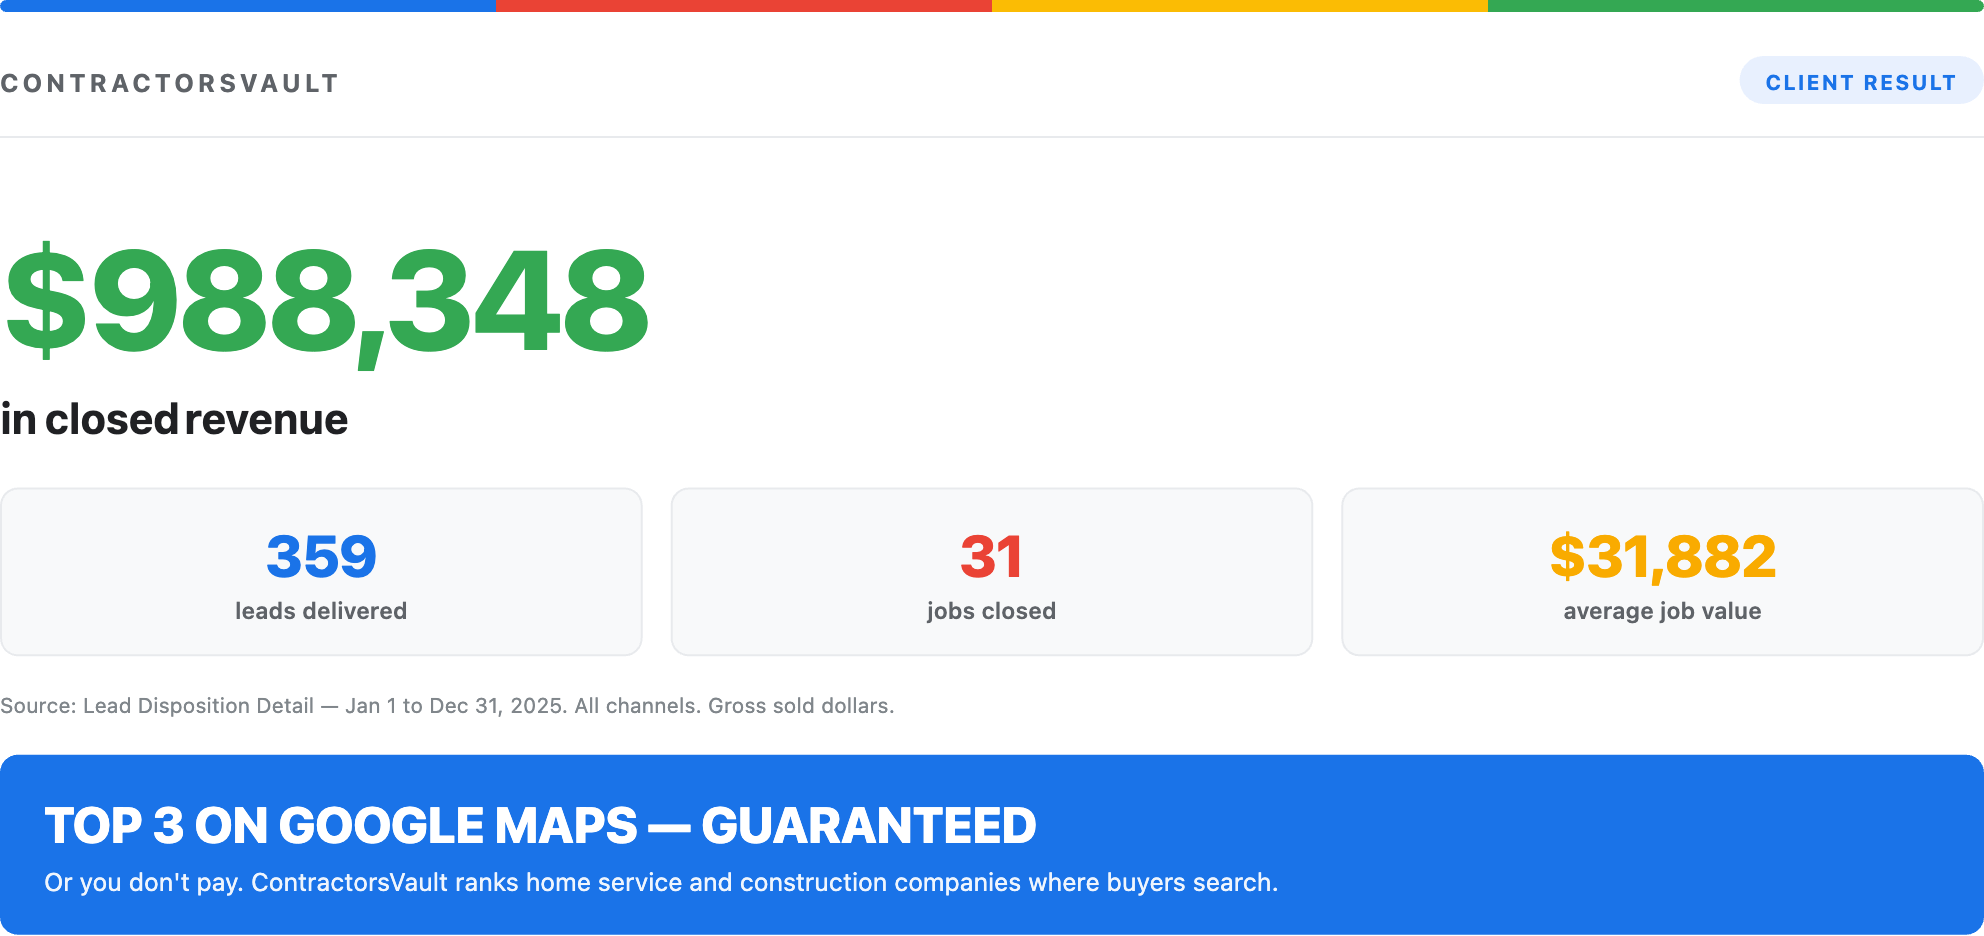
    CRM export showing $988,348 in client-verified closed revenue from 359 leads and 31 jobs
    Full year. 359 leads, 31 jobs closed, $31,882 average job value.
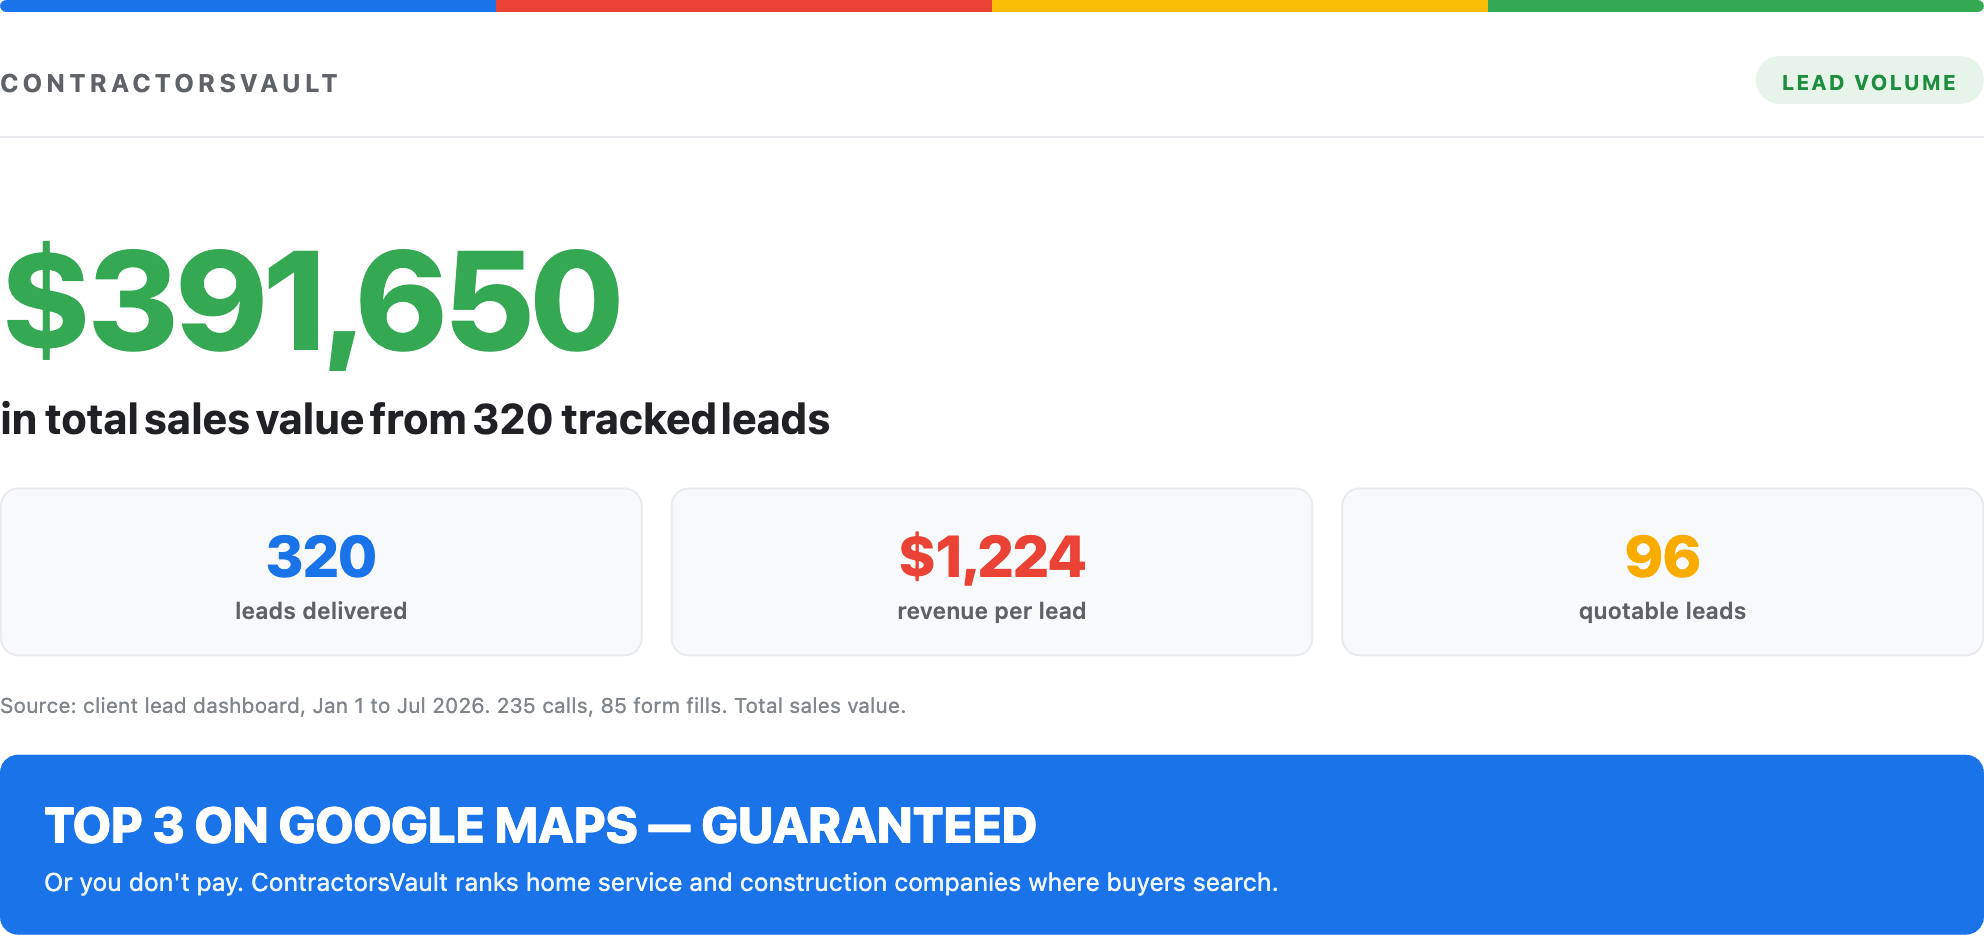
    CRM export showing $391,650 in client-verified total sales value from 320 tracked leads
    320 tracked leads, 96 quotable, $1,224 revenue per lead.
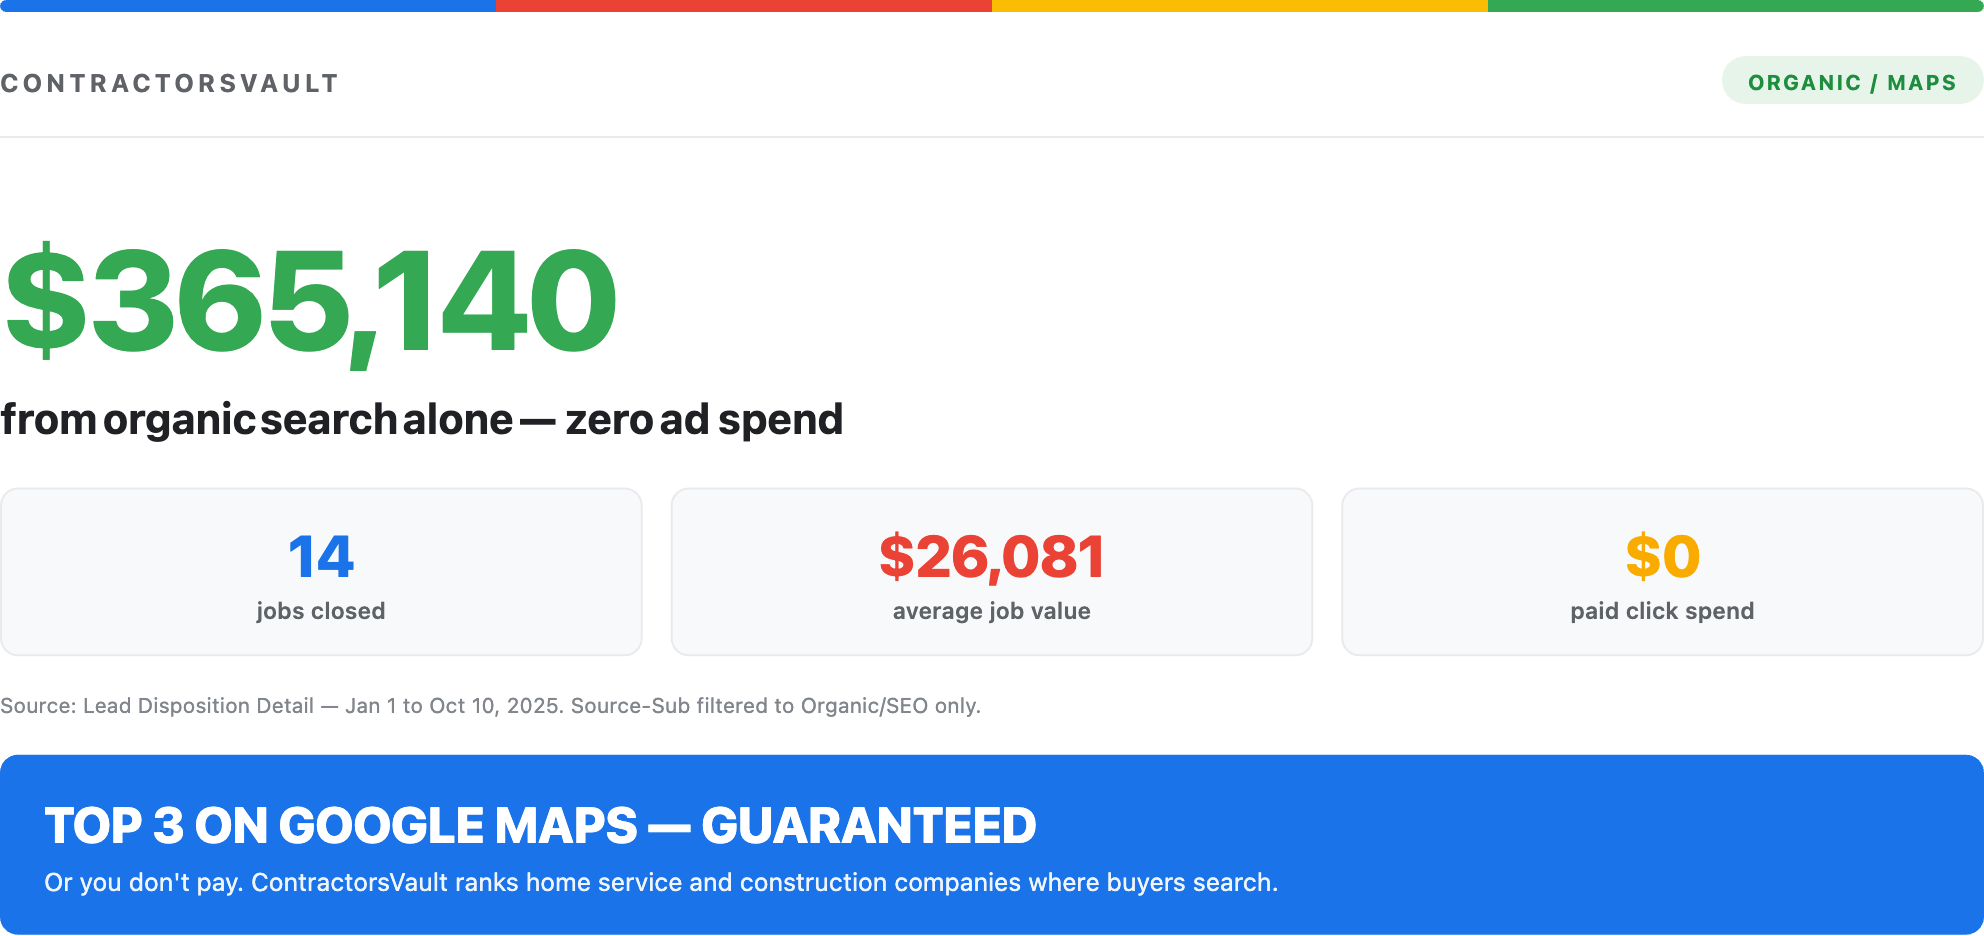
    CRM export showing $365,140 from organic search and Google Maps with zero ad spend
    Organic and Maps only. 14 jobs closed, $0 paid click spend.
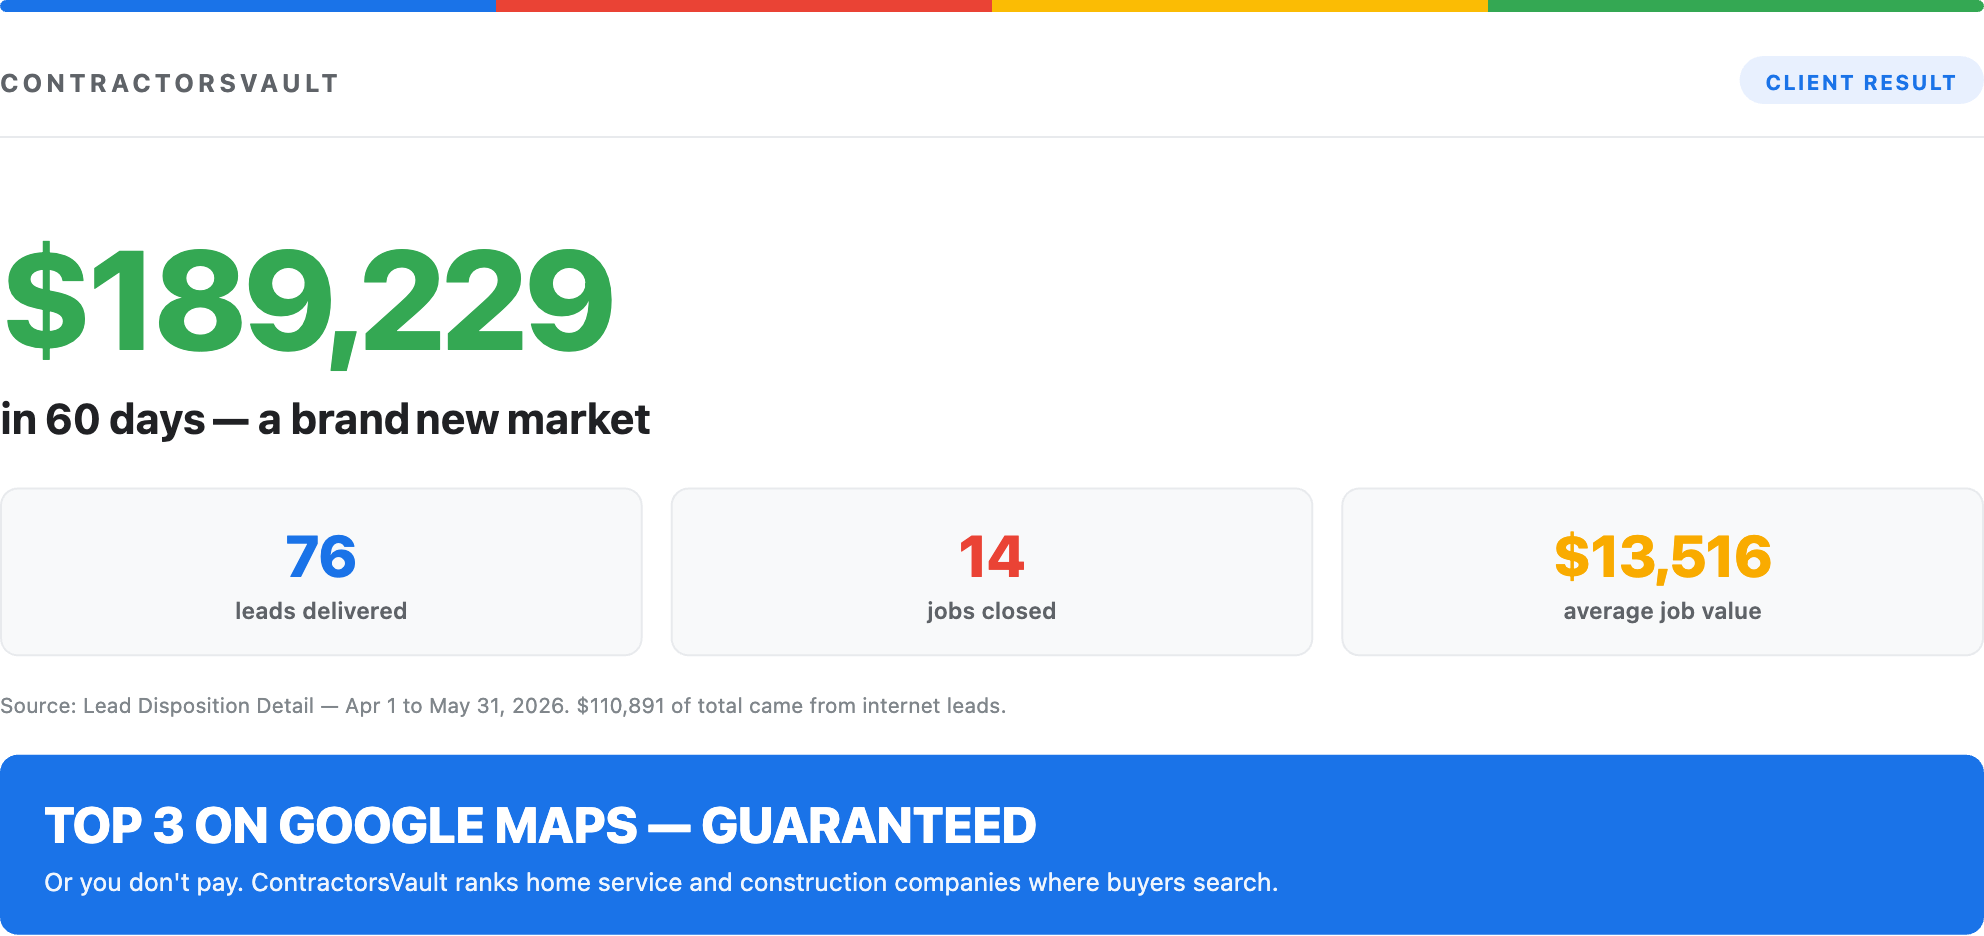
    CRM export showing $189,229 closed in the first 60 days in a brand new market
    Brand new market, first 60 days. 76 leads, 14 jobs closed.
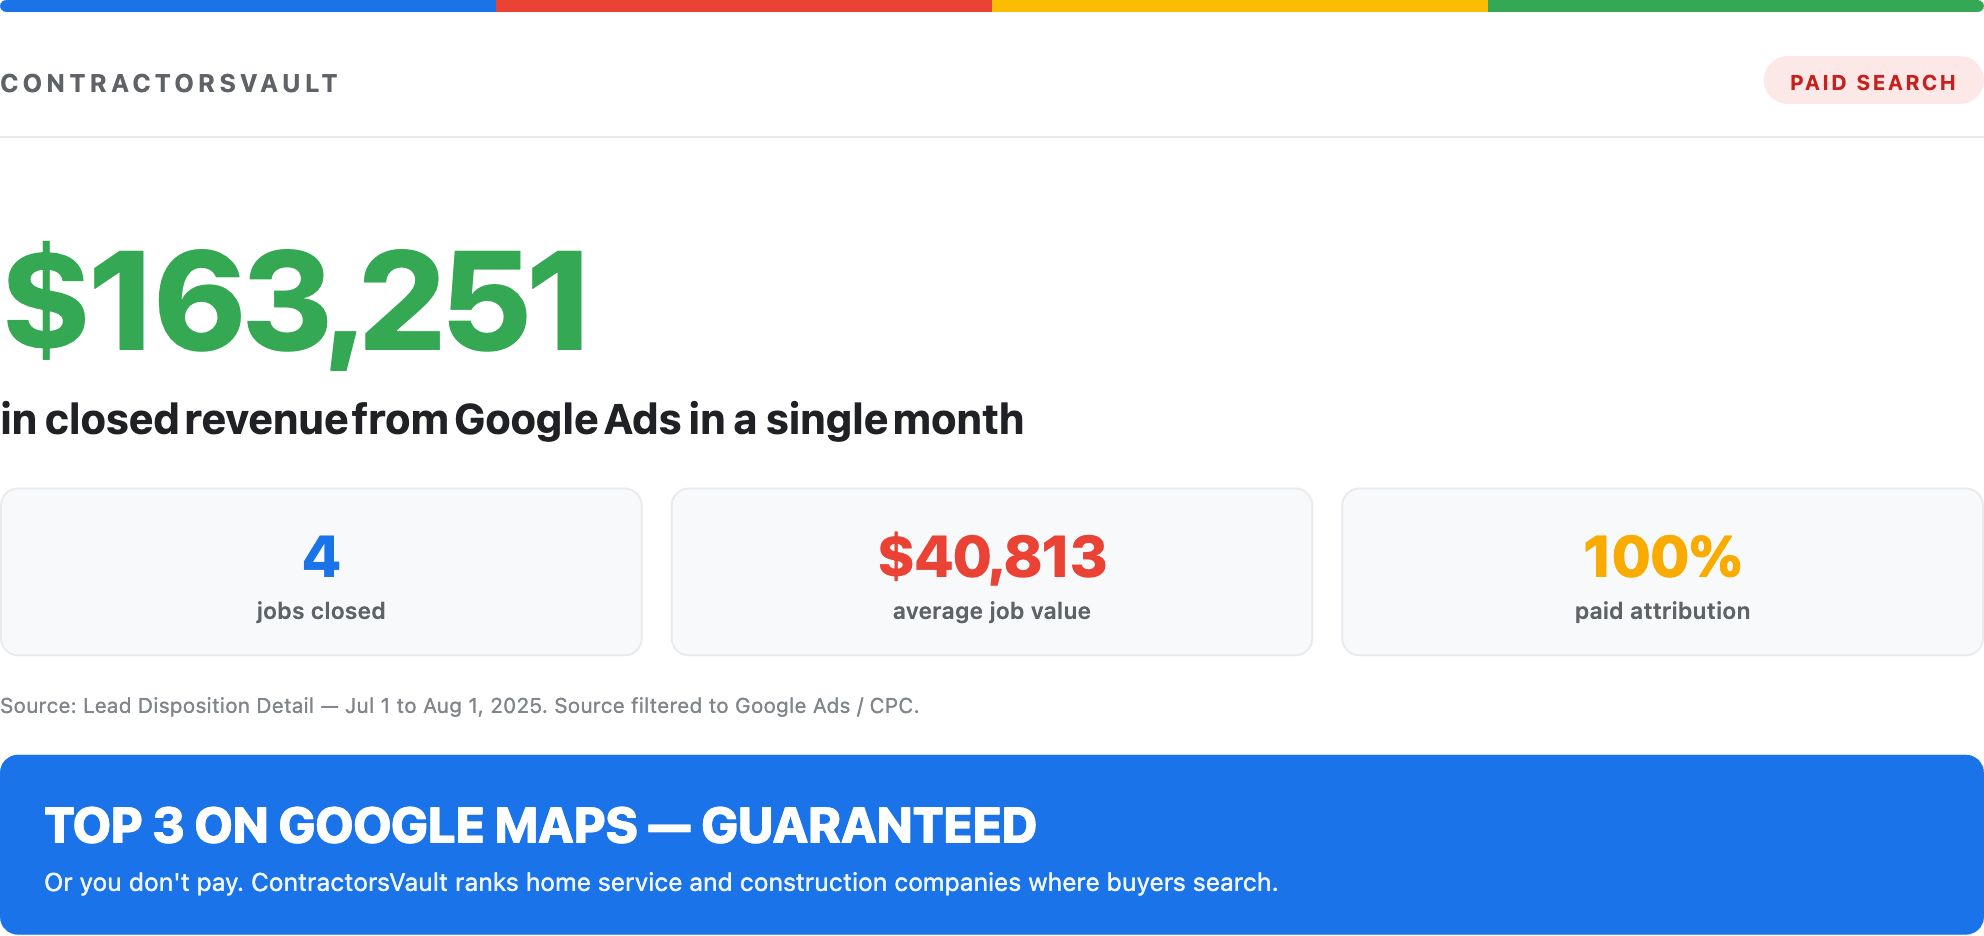
    CRM export showing $163,251 in closed revenue from Google Ads in a single month
    Google Ads, single month. $40,813 average job value.
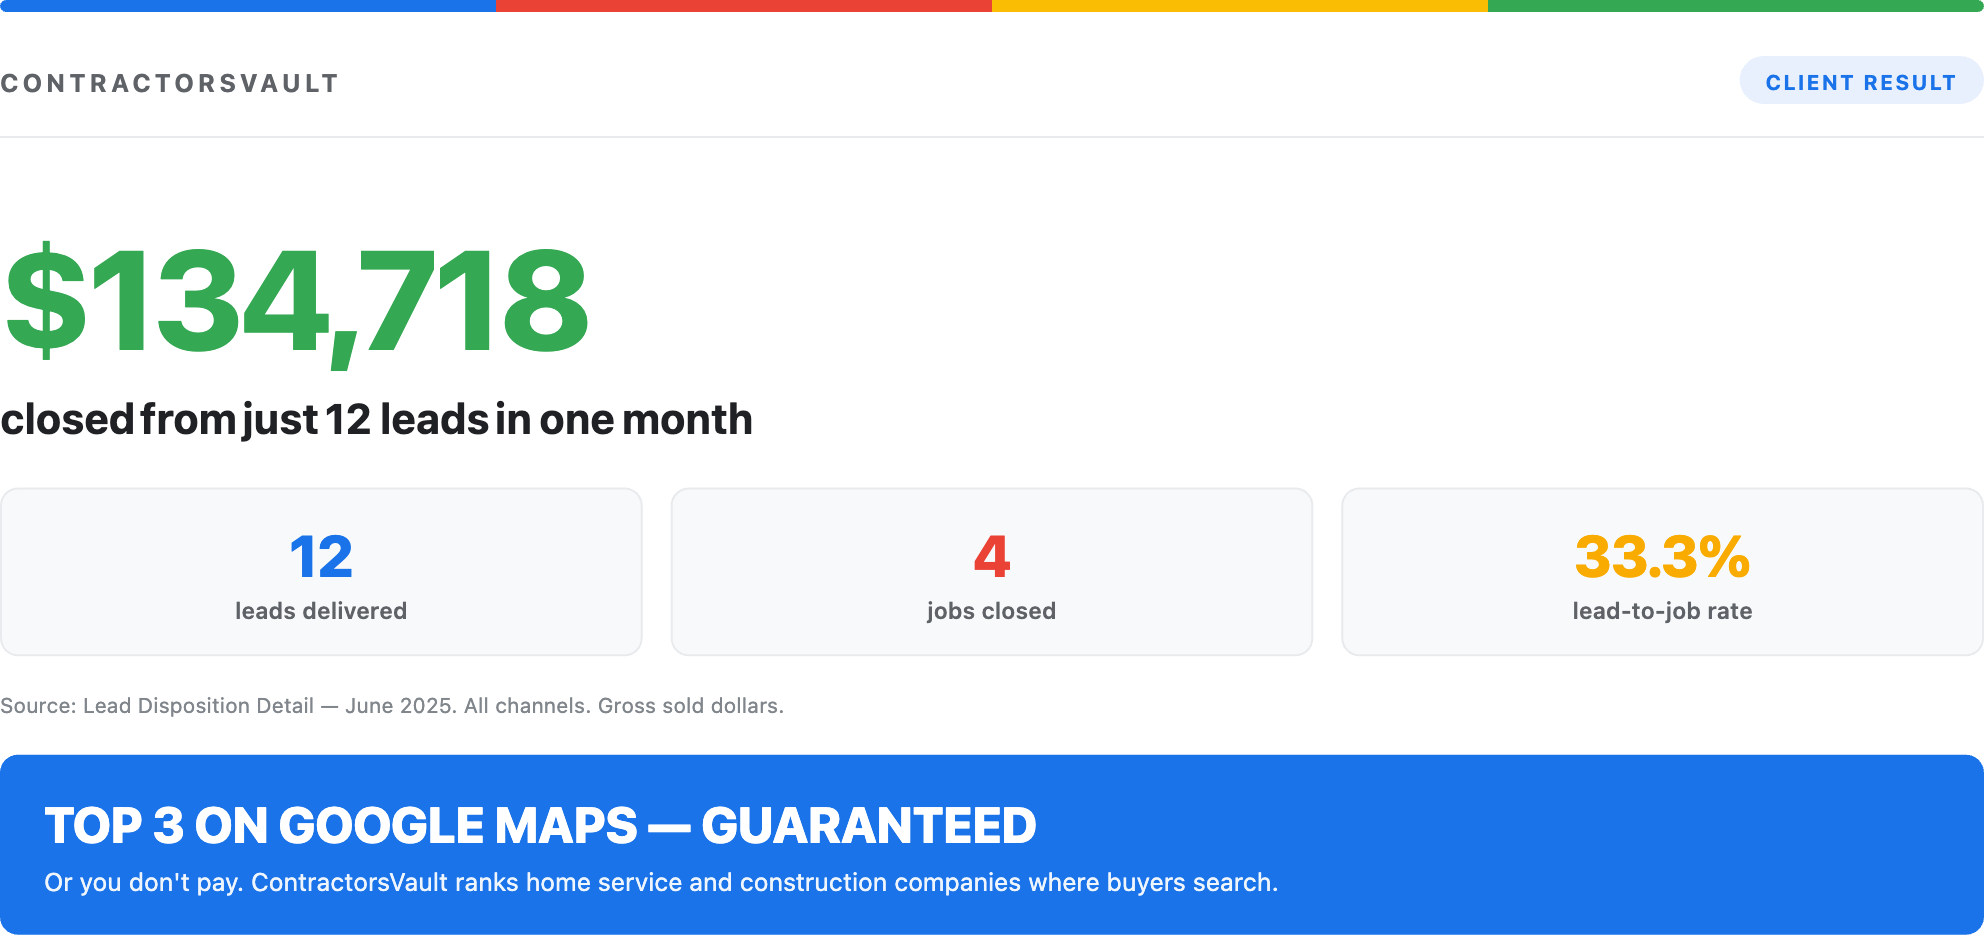
    CRM export showing $134,718 closed from just 12 leads in one month
    One month. 12 leads, 4 jobs, a 33.3% lead-to-job rate.
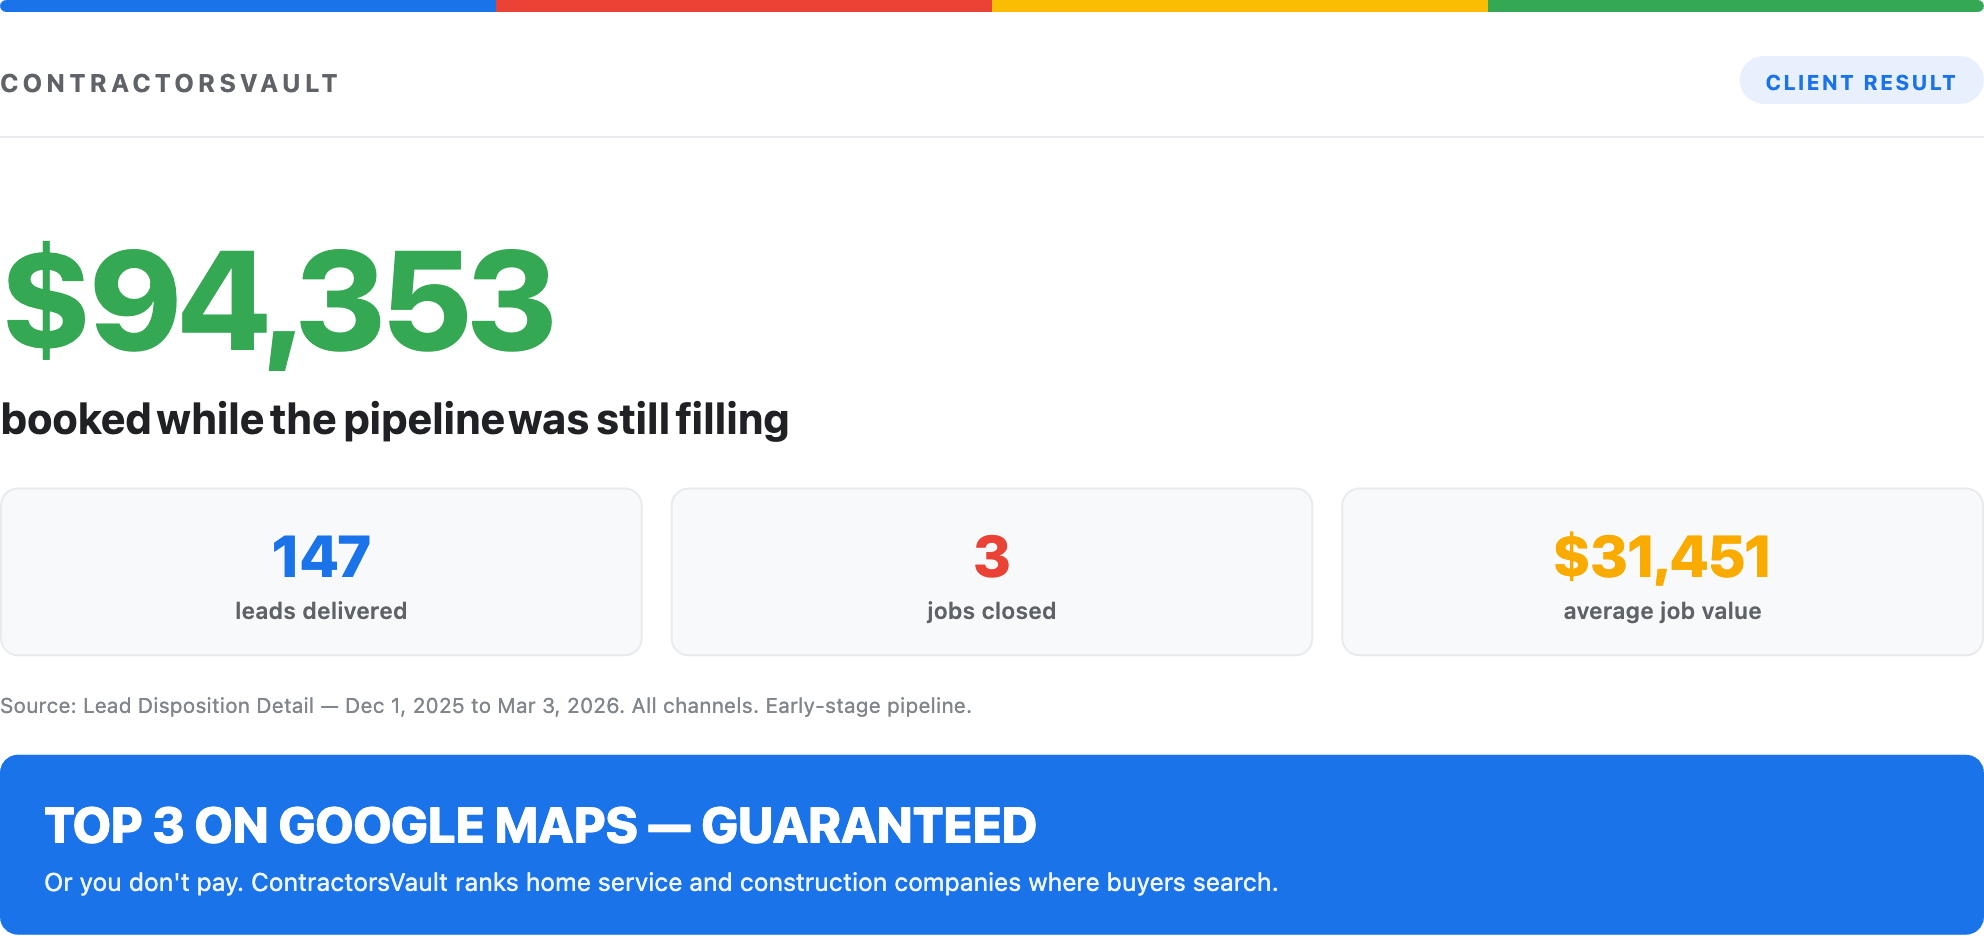
    CRM export showing $94,353 booked while the pipeline was still filling
    Early-stage pipeline. 147 leads, 3 jobs closed so far.
    Featured Case Study

    Brand-New Profile Into the Top 3 in Three Months

    A Tampa-area siding company started with a brand-new Google Business Profile and 18 reviews. Three months later it held the number-two spot on Google Maps with a 3.75 average rank and 67.72% market share for its main siding search, measured across a 13x13 grid of 169 points covering nearly 900 square miles.
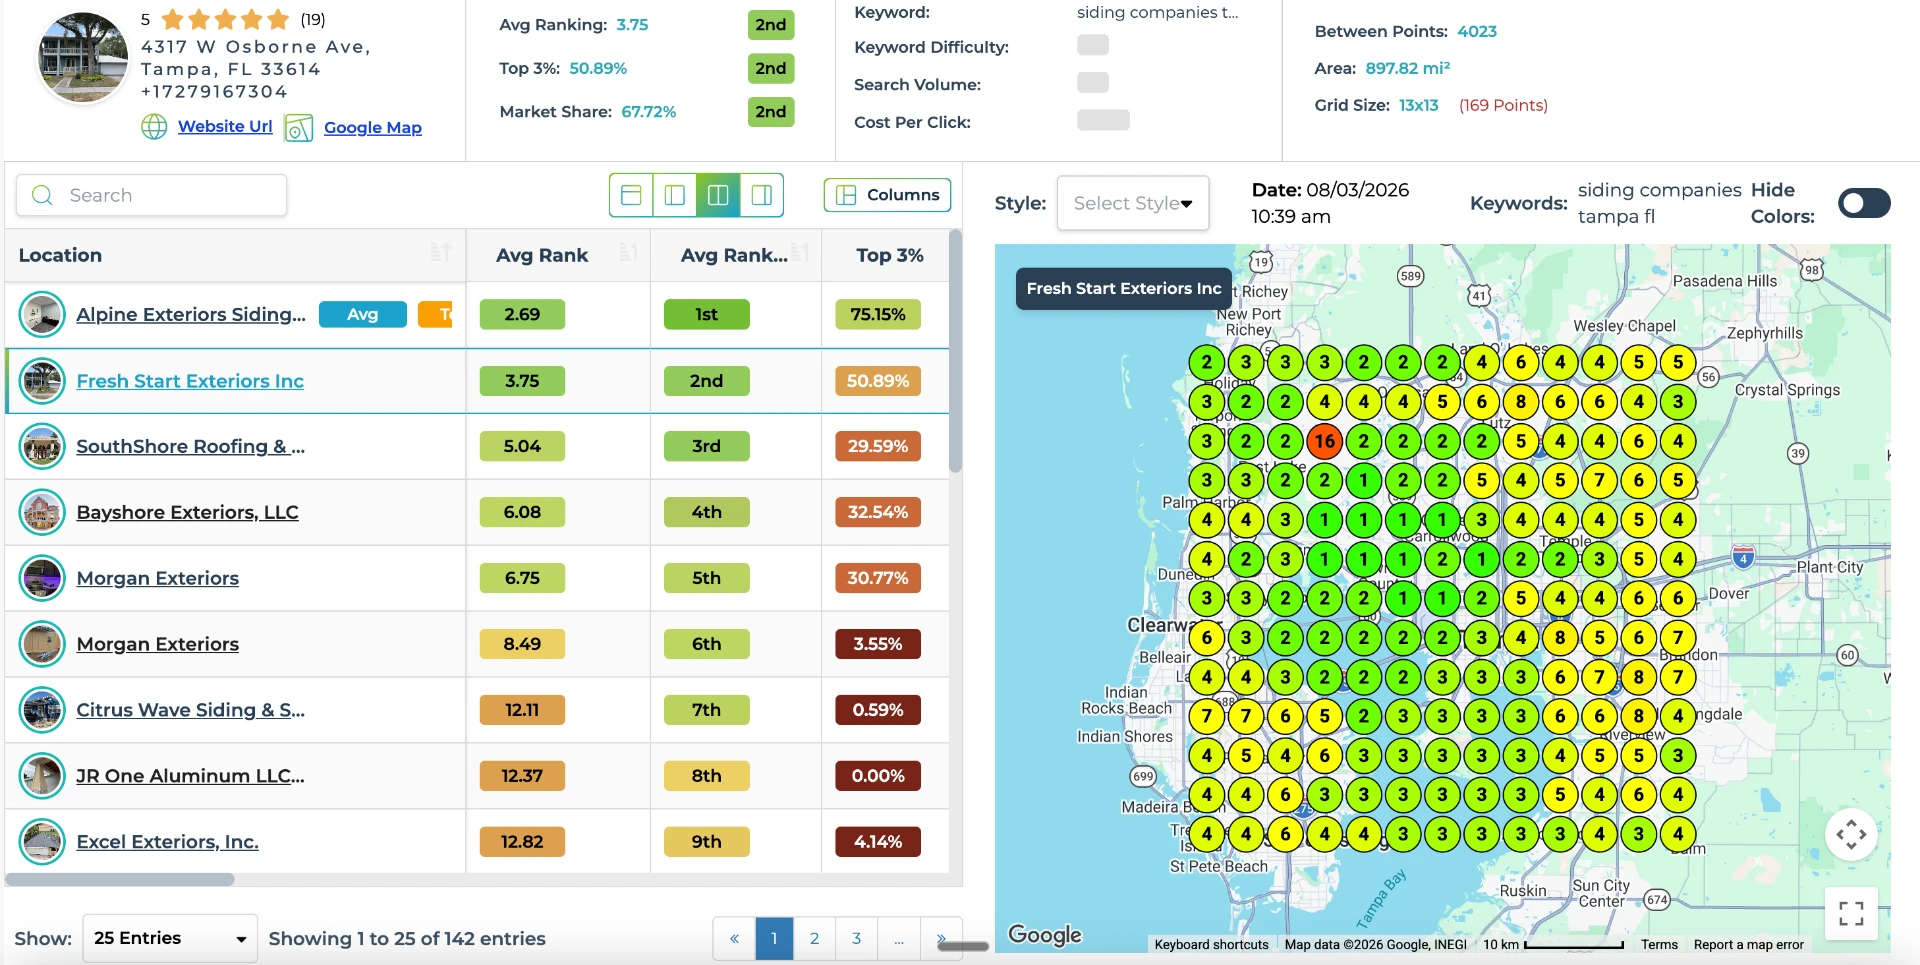
    Google Maps ranking grid for siding companies in Tampa showing a 3.75 average rank, number-two position, and 67.72% market share
    Ranking grid for "siding companies tampa fl." Average rank 3.75, top 3 in 50.89% of the grid.

    Then the Phone Starts Moving

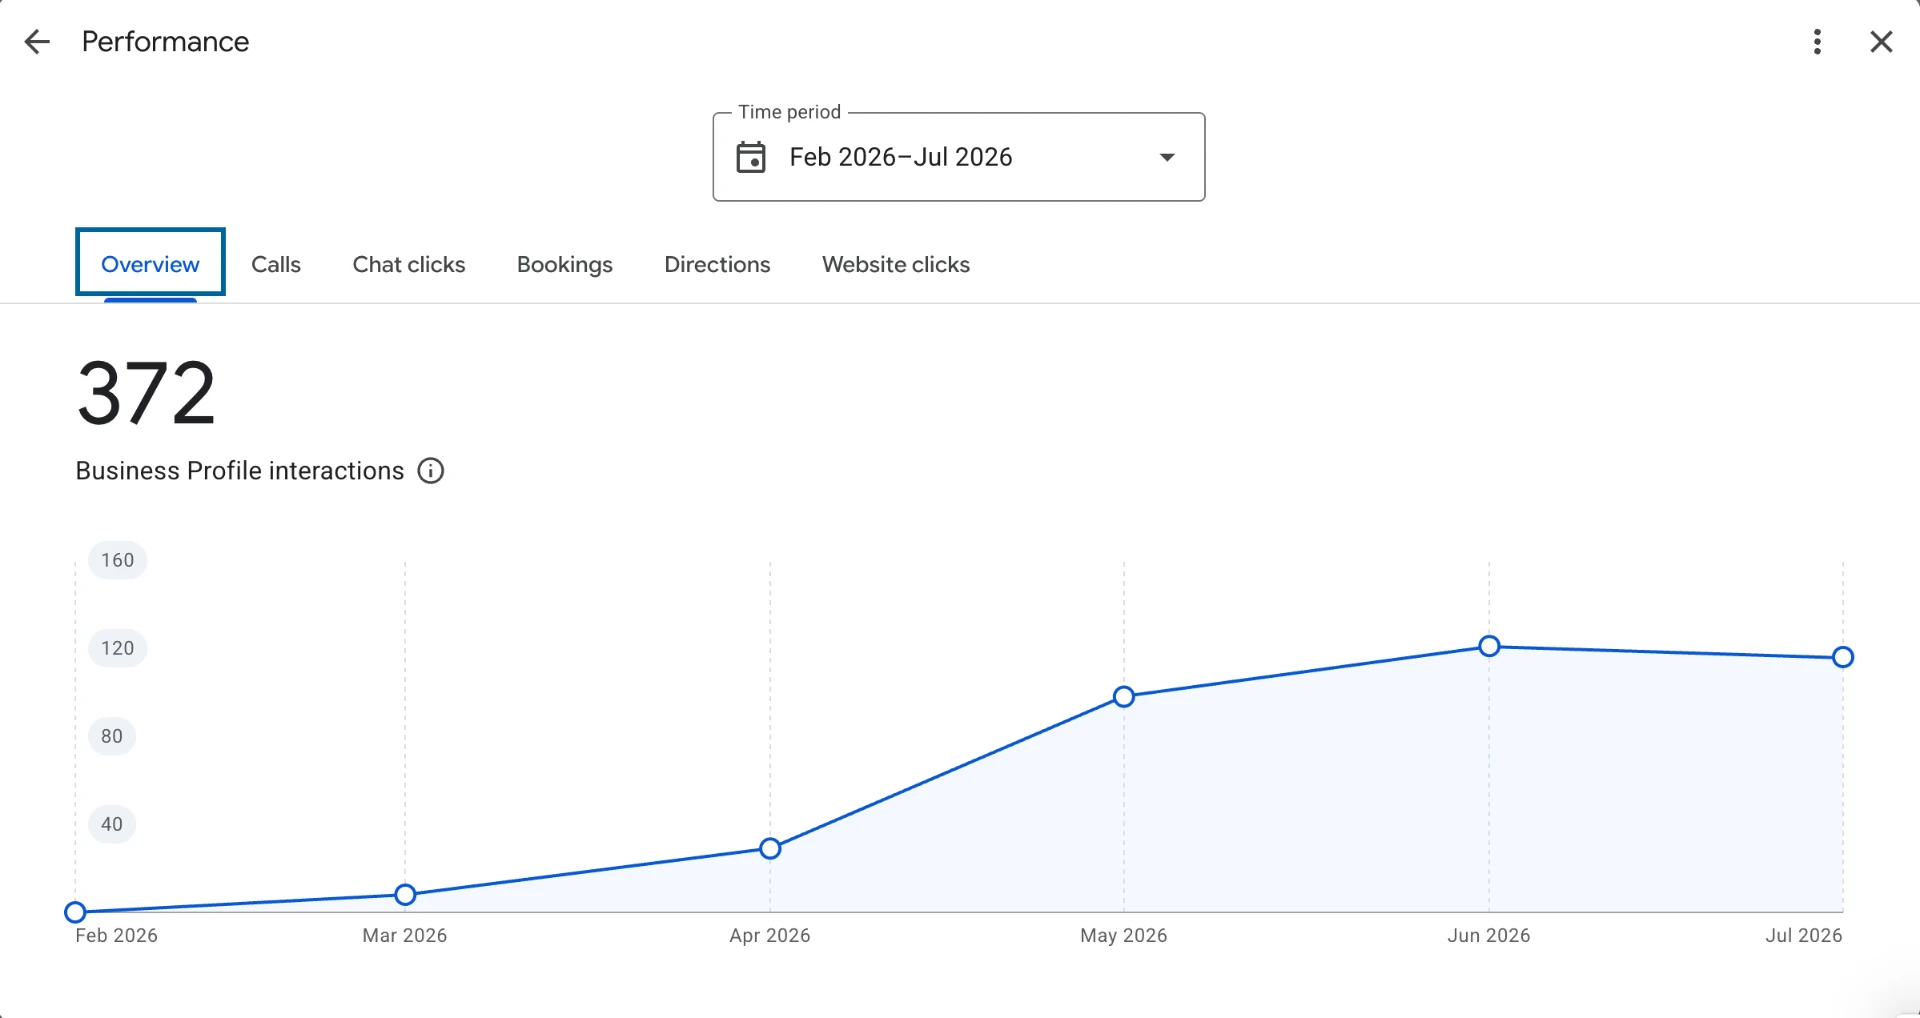
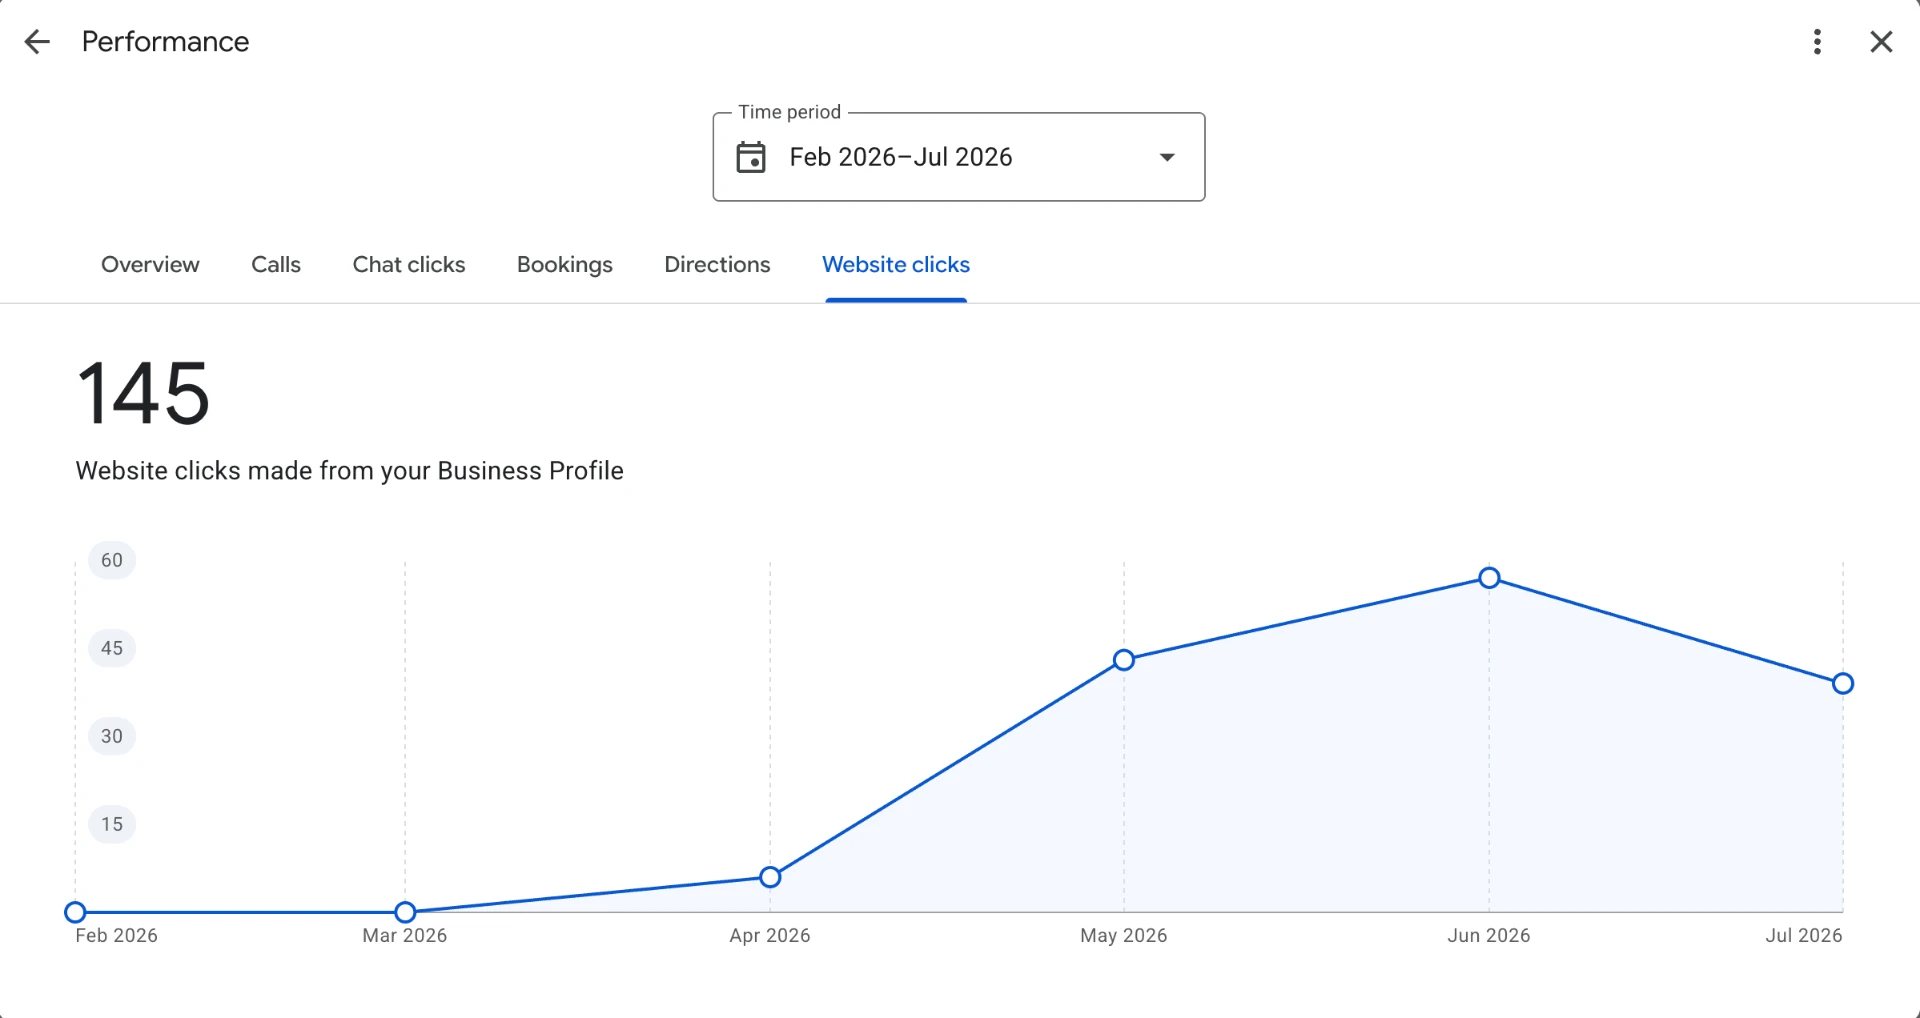
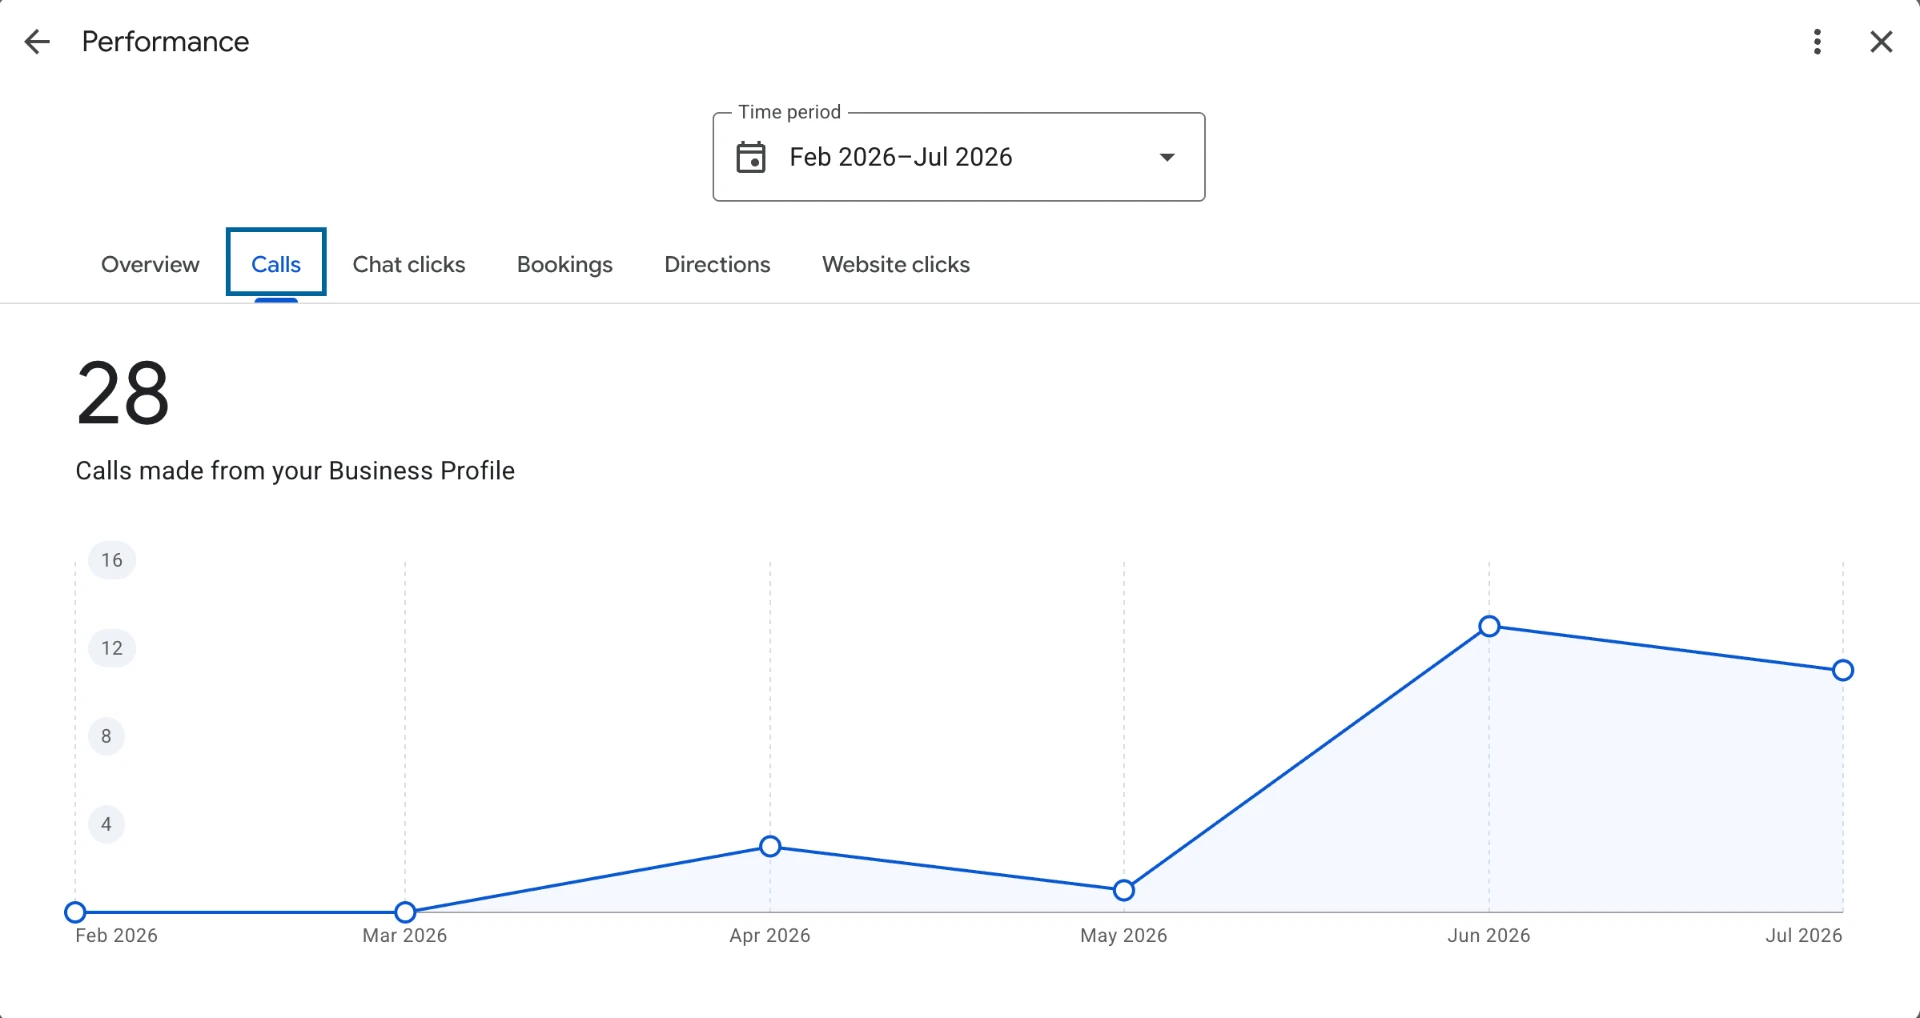
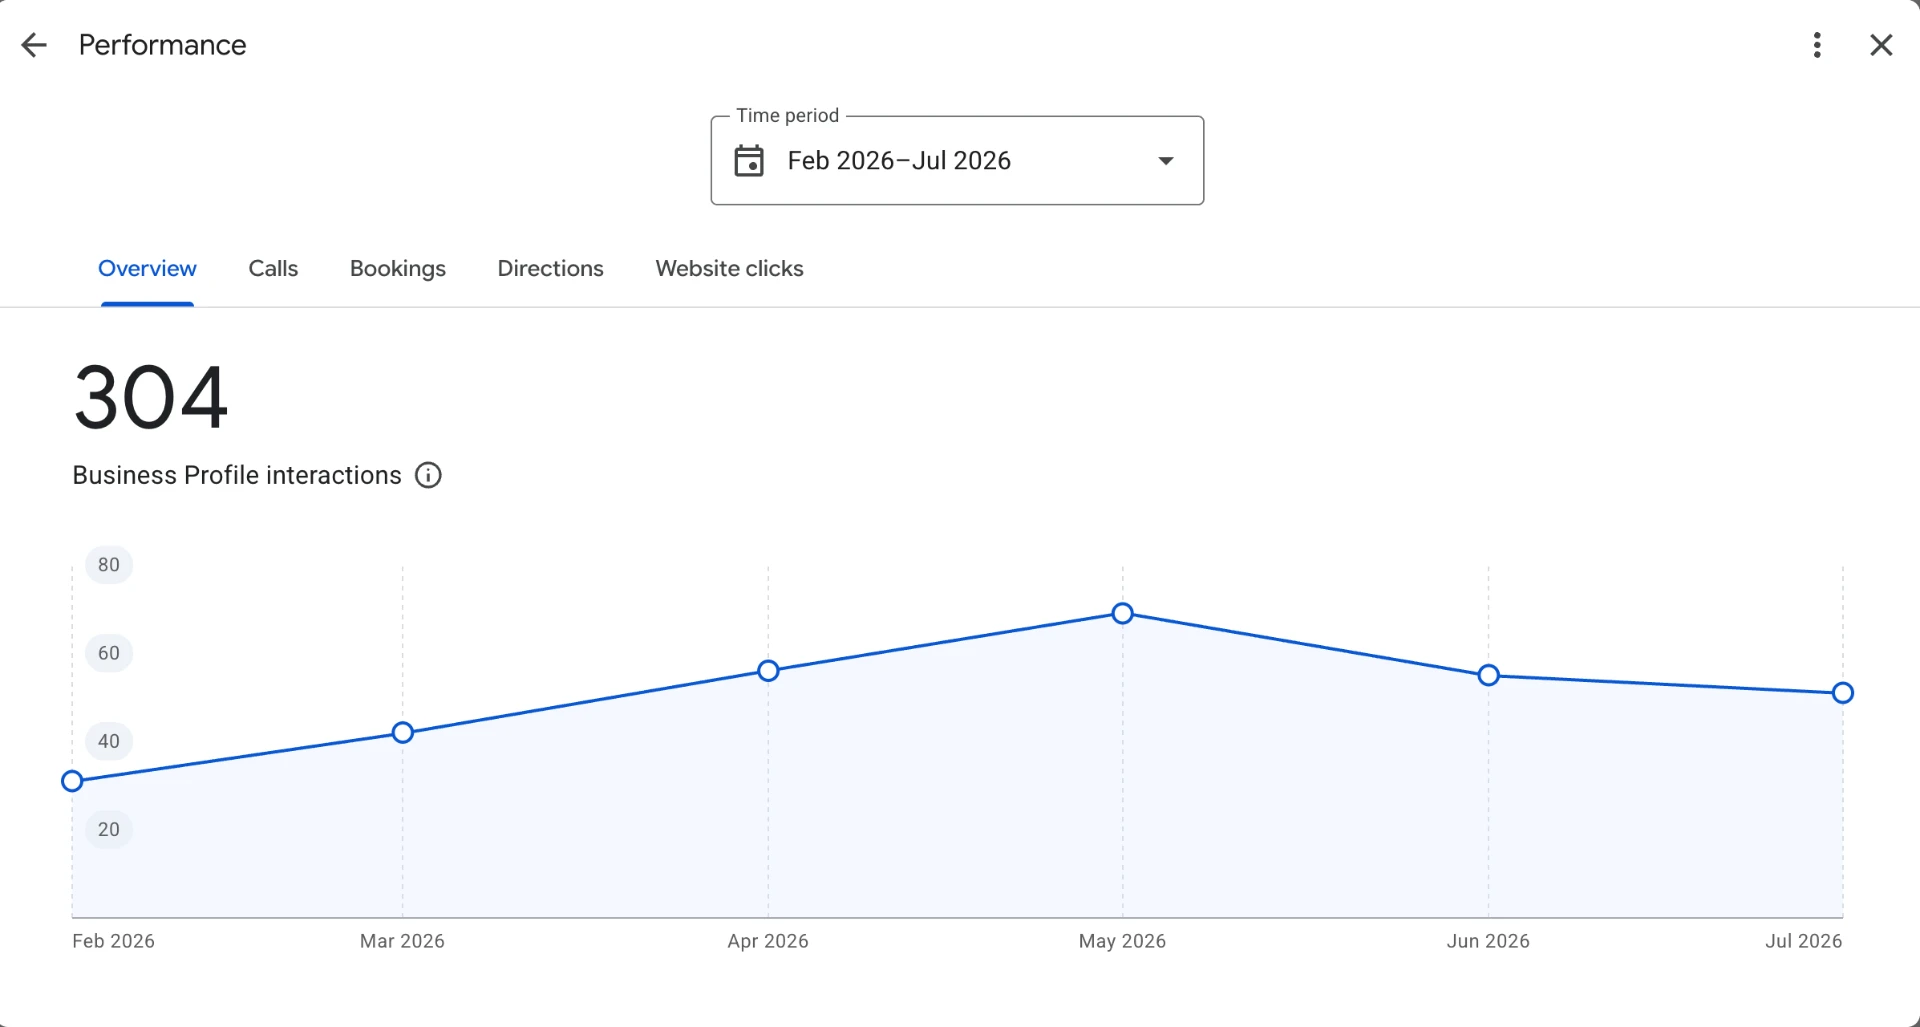
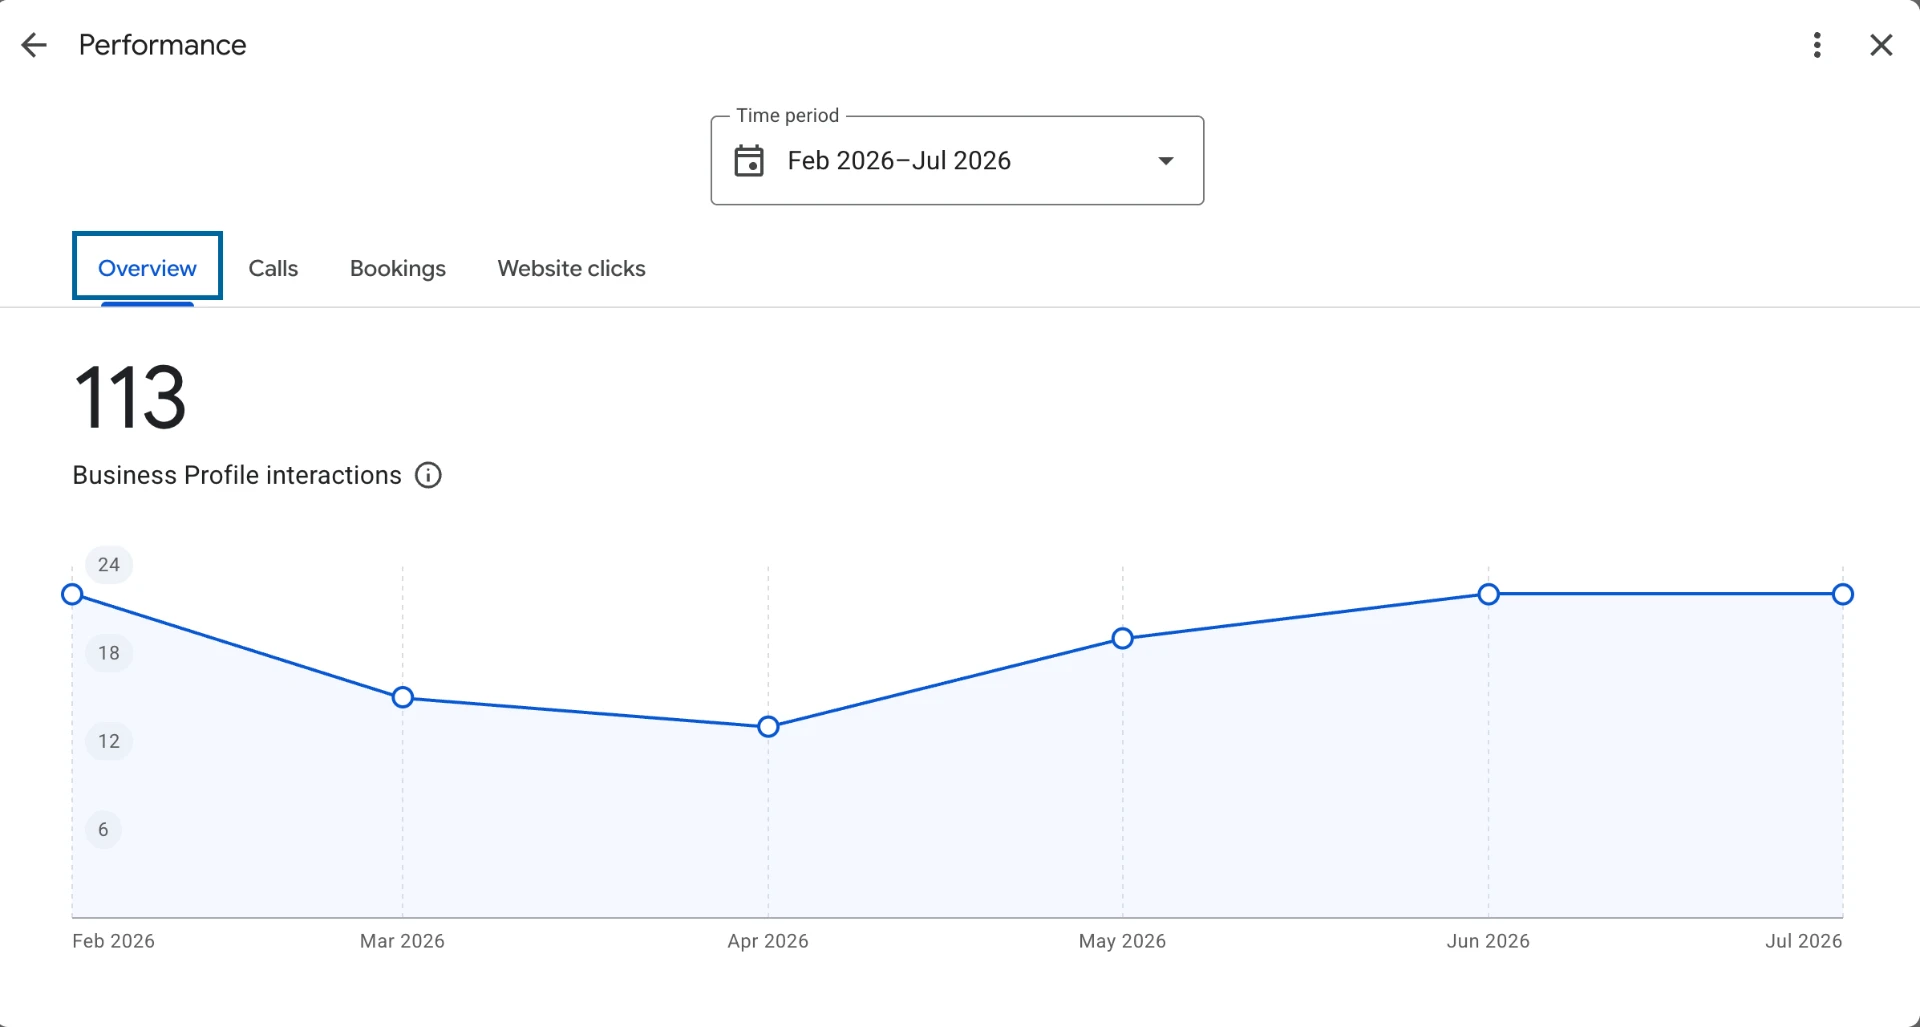
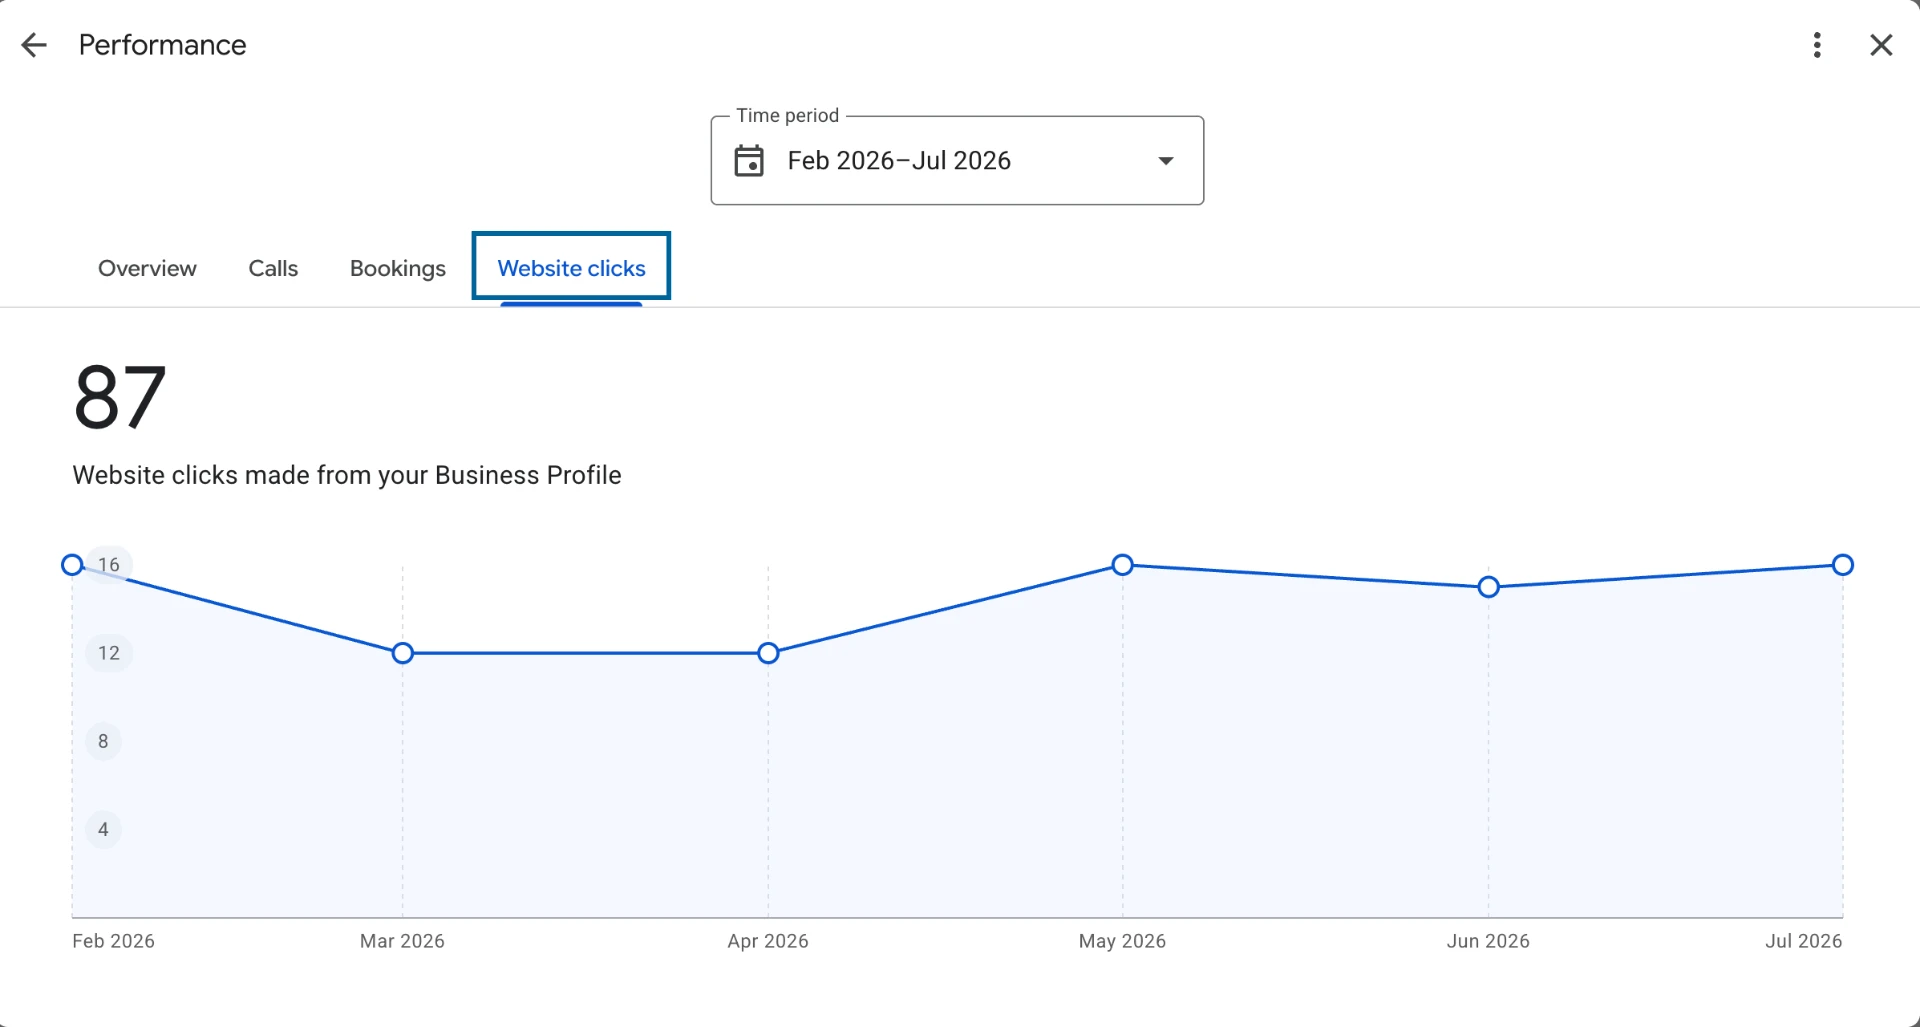
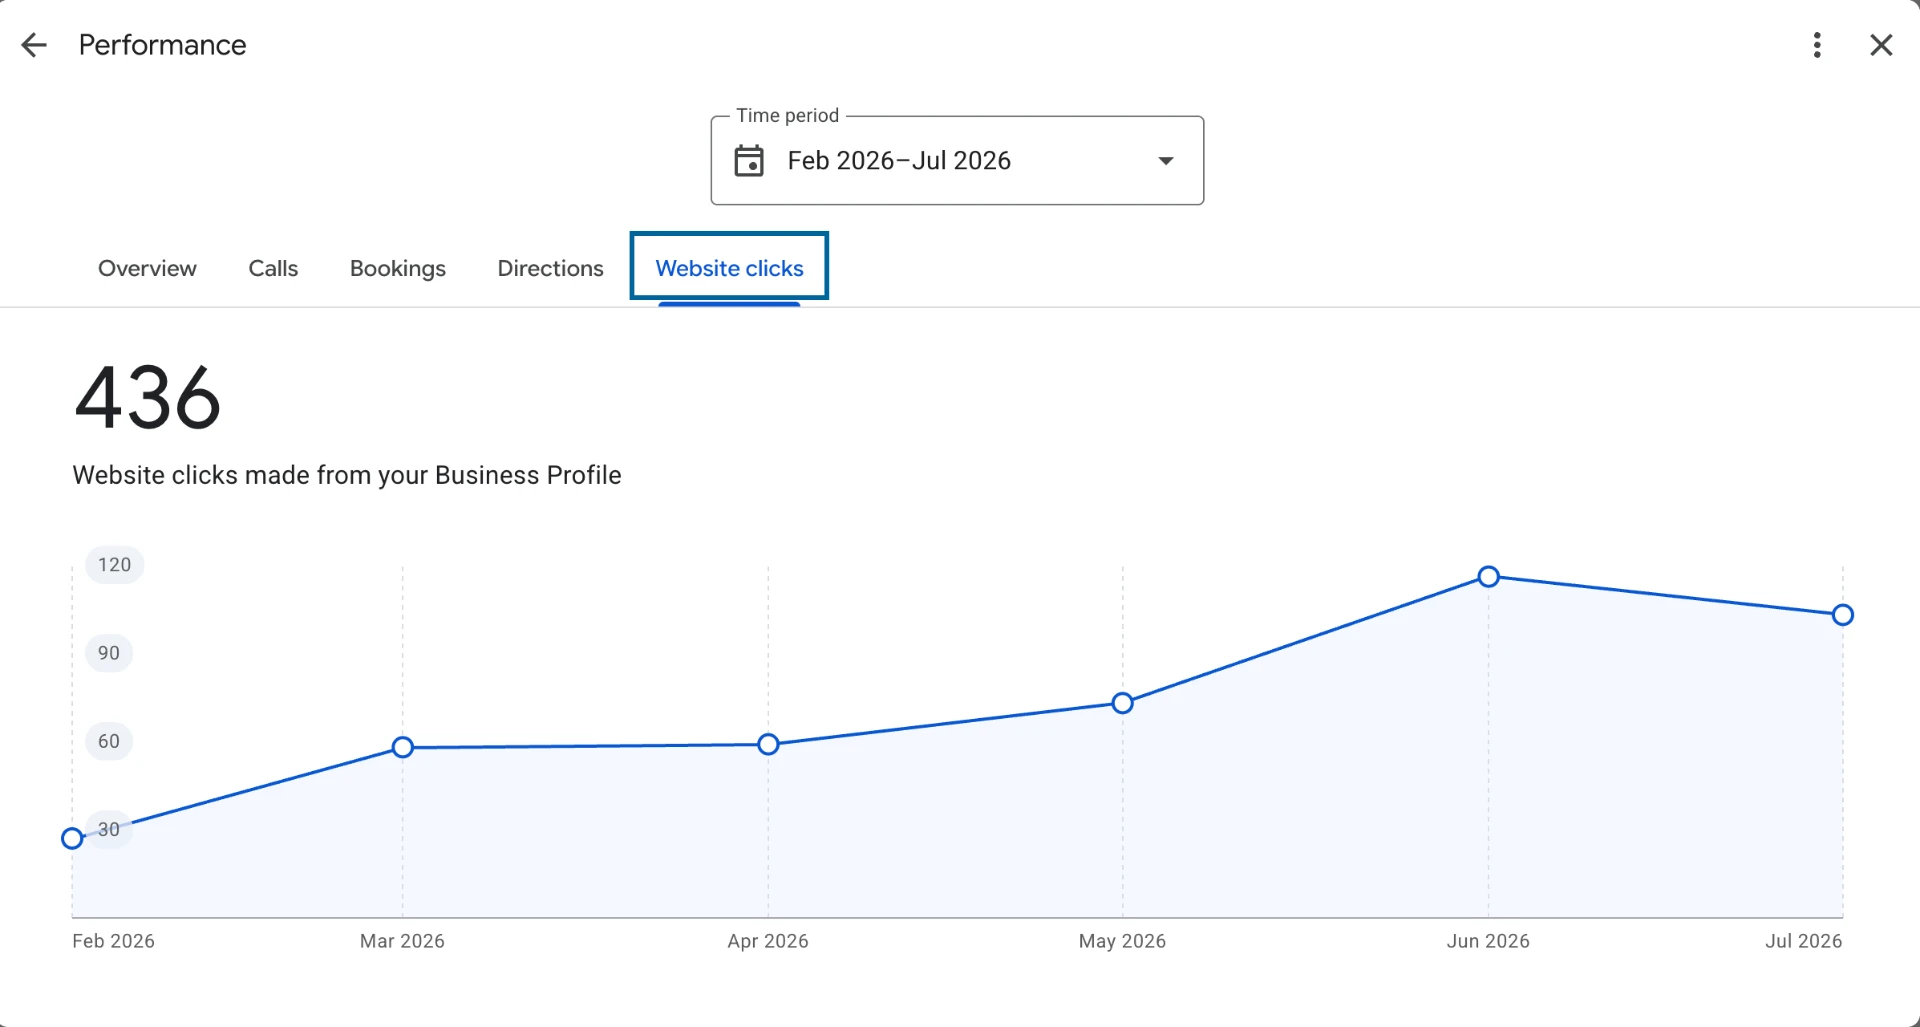
    Better map placement shows up first as more calls, more website clicks, and more people tapping the profile. These charts come straight from Google.
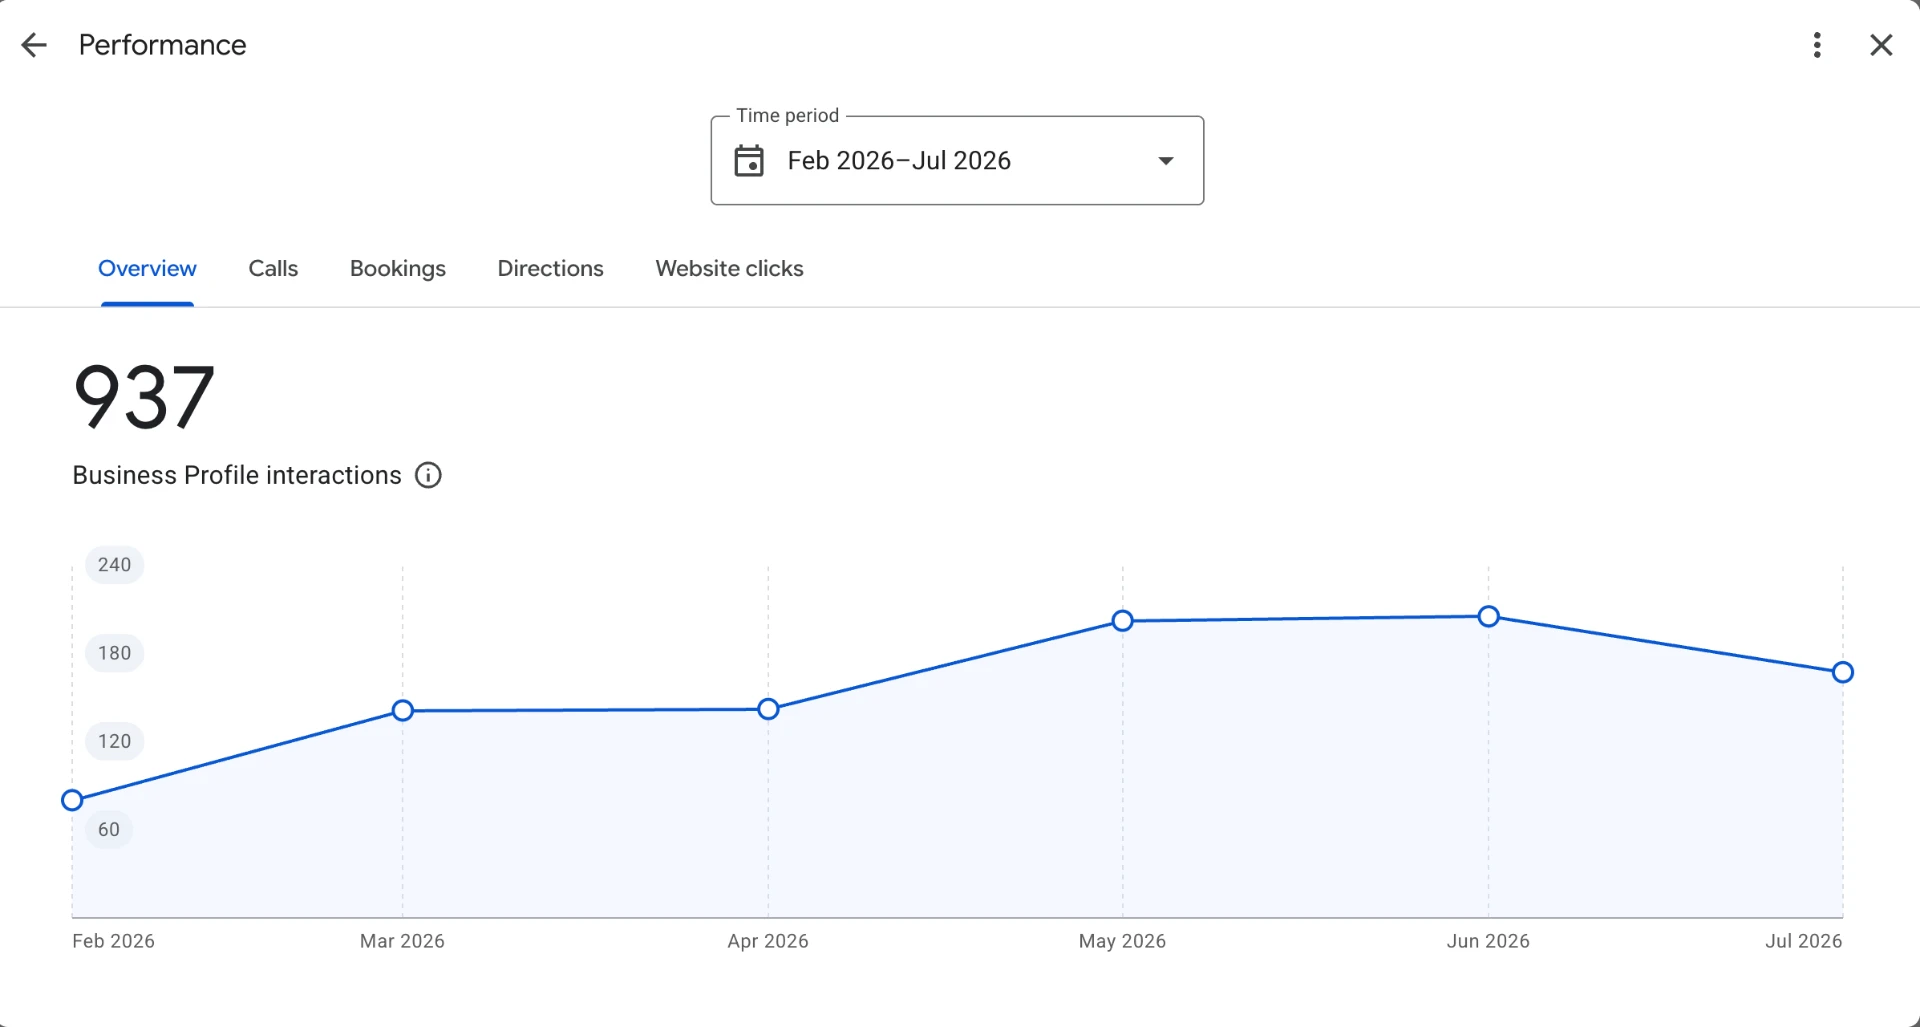
    Google Business Profile report showing 937 profile interactions from February to July
    937 profile interactions, Feb to Jul.
    Google Business Profile report showing 436 website clicks from February to July
    436 website clicks over the same period.
    Google Business Profile report showing 372 profile interactions from February to July
    372 profile interactions, up from near zero in February.
    Google Business Profile report showing 145 website clicks from February to July
    145 website clicks as visibility climbed.
    Google Business Profile report showing 28 calls made from the profile between February and July
    28 direct calls booked from the listing.
    Google Business Profile report showing 304 profile interactions from February to July
    304 profile interactions over the same stretch.
    Google Business Profile report showing 113 profile interactions from February to July
    113 profile interactions on a newer, smaller account.
    Google Business Profile report showing 87 website clicks from February to July
    87 website clicks on the same account.

    Individual results vary by market, competition, location, implementation, reviews, and service demand. That is also why we do not offer a ranking guarantee to every company.

    Real Results

    Want Numbers Like These Traced Back to Your Own Jobs?

    Send your details and we'll reach out, or talk with our team directly.

    • No long sales pitch
    • We review your site and traffic
    • Clear next steps within 1 business day

    Have Us Reach Out

    Send your details. We'll review and follow up.

    No long sales pitch. We review what you've sent and reach out with next steps.